Prometheus monitoring and alerting
Prometheus is an open-source systems monitoring and alerting toolkit. Prometheus collects and stores metrics as time-series data, i.e. metrics information is stored with the timestamp at which it was recorded, alongside optional key-value pairs called labels.
Users can measure the internal status of a QuestDB instance via an HTTP endpoint
exposed by QuestDB at port 9003. This document describes how to enable metrics
via this endpoint, how to configure Prometheus to scrape metrics from a QuestDB
instance, and how to enable alerting from QuestDB to Prometheus Alertmanager.
For guidance on what metrics to monitor and alerting strategies, see Monitoring and alerting.
Prerequisites
-
QuestDB must be running and accessible. Checkout the quick start.
-
Prometheus can be installed using homebrew, Docker, or directly as a binary. For more details, refer to the official Prometheus installation instructions.
-
Alertmanager can be run using Docker or Quay, or can be built from source by following the build instructions on GitHub.
Scraping Prometheus metrics from QuestDB
QuestDB has a /metrics HTTP endpoint on port 9003 to expose Prometheus
metrics. Before being able to query metrics, they must be enabled via the
metrics.enabled key in server configuration:
metrics.enabled=true
When running QuestDB via Docker, port 9003 must be exposed and the metrics
configuration can be enabled via the QDB_METRICS_ENABLED environment variable:
docker run \
-e QDB_METRICS_ENABLED=TRUE \
-p 8812:8812 -p 9000:9000 -p 9003:9003 -p 9009:9009 \
-v "$(pwd):/var/lib/questdb" \
questdb/questdb:9.3.3
To verify that metrics are being exposed correctly by QuestDB, navigate to
http://<questdb_ip>:9003/metrics in a browser, where <questdb_ip> is the IP
address of an instance, or execute a basic curl like the following example:
curl http://127.0.0.1:9003/metrics
# TYPE questdb_json_queries_total counter
questdb_json_queries_total 0

# TYPE questdb_memory_tag_MMAP_DEFAULT gauge
questdb_memory_tag_MMAP_DEFAULT 77872

# TYPE questdb_memory_malloc_count gauge
questdb_memory_malloc_count 659

# ...
To configure Prometheus to scrape these metrics, provide the QuestDB instance IP
and port 9003 as a target. The following example configuration file
questdb.yml assumes there is a running QuestDB instance on localhost
(127.0.0.1) with port 9003 available:
global:
  scrape_interval: 5s
  external_labels:
    monitor: 'questdb'

scrape_configs:
  - job_name: 'questdb'
    scrape_interval: 5s
    static_configs:
      - targets: ['127.0.0.1:9003']
Start Prometheus and pass this configuration on launch:
prometheus --config.file=questdb.yml
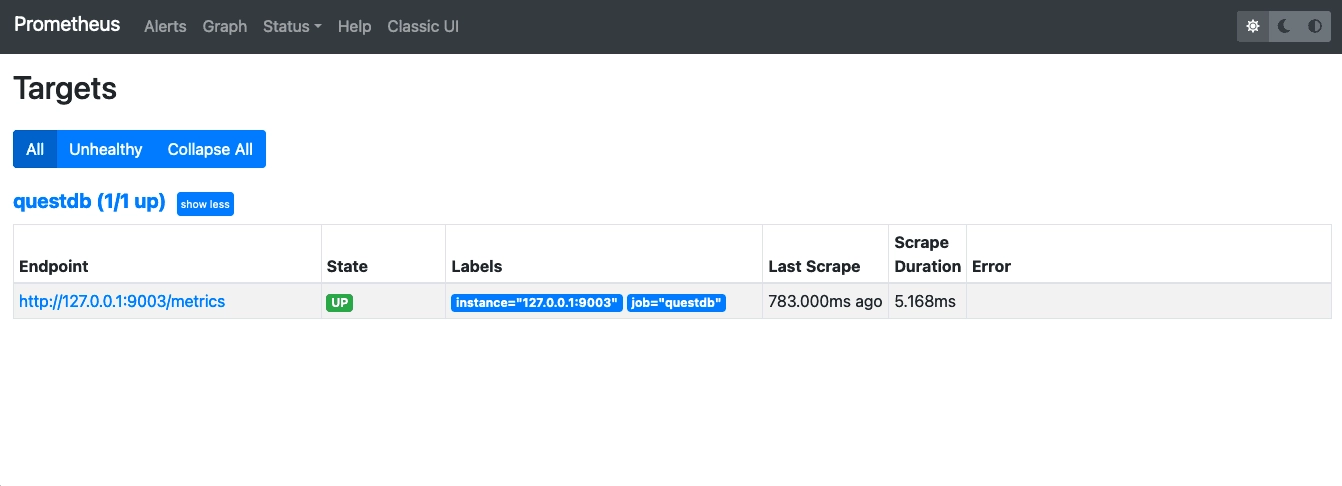
Prometheus should be available on 0.0.0.0:9090 and navigating to
http://0.0.0.0:9090/targets should show that QuestDB is being scraped
successfully:
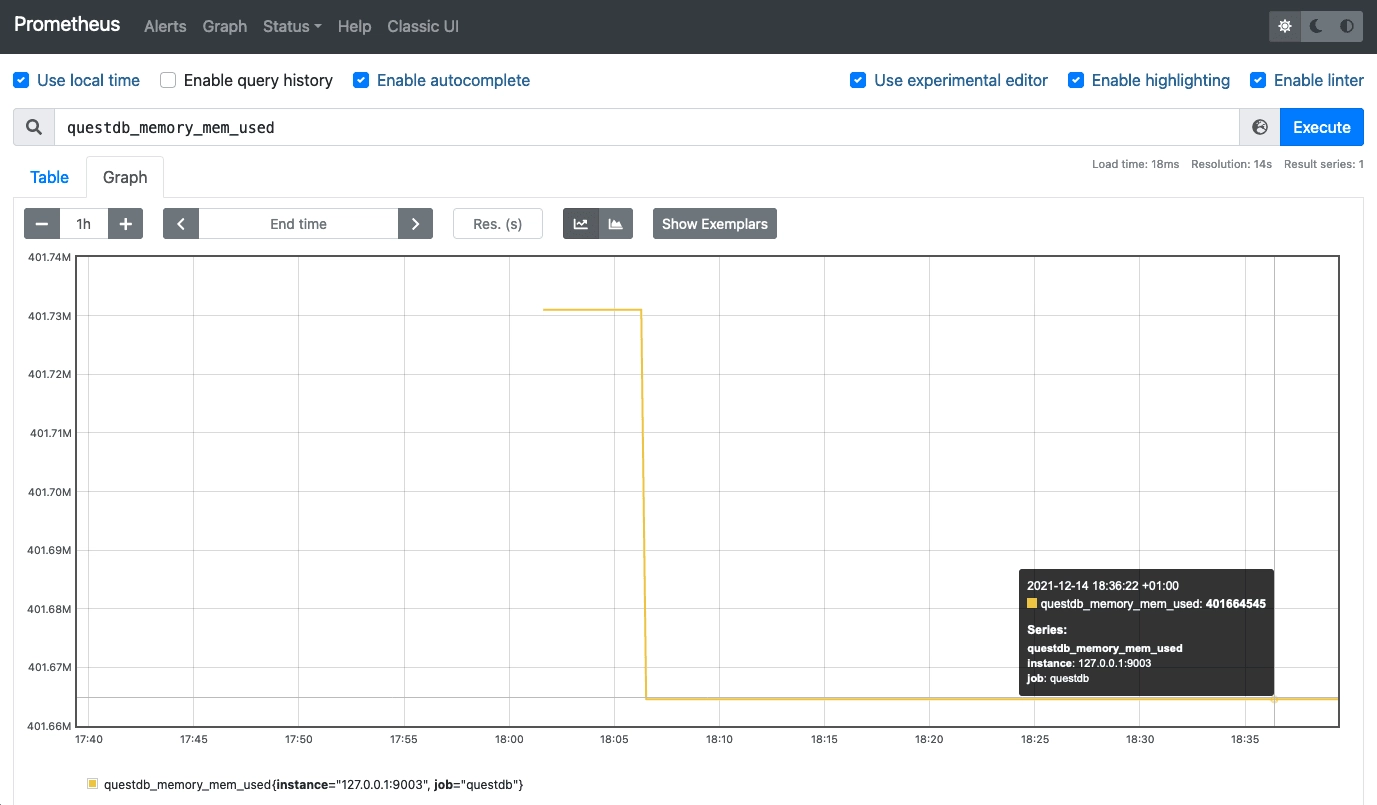
In the graphing tab of Prometheus (http://0.0.0.0:9090/graph), autocomplete
can be used to graph QuestDB-specific metrics which are all prefixed with
questdb_:
The following metrics are available:
Commit metrics
| Metric | Type | Description |
|---|---|---|
questdb_commits_total | counter | Total commits of all types (in-order and out-of-order) executed on database tables. |
questdb_o3_commits_total | counter | Total out-of-order (O3) commits executed on database tables. |
questdb_committed_rows_total | counter | Total rows committed to database tables. |
questdb_physically_written_rows_total | counter | Total rows physically written to disk. Greater than committed_rows with out-of-order ingestion. Write amplification is physically_written_rows / committed_rows. |
questdb_rollbacks_total | counter | Total rollbacks executed on database tables. |
Query metrics
| Metric | Type | Description |
|---|---|---|
questdb_json_queries_total | counter | Total REST API queries, including retries. |
questdb_json_queries_completed_total | counter | Successfully executed REST API queries. |
questdb_json_queries_cached | gauge | Current cached REST API queries. |
questdb_json_queries_cache_hits_total | counter | Total cache hits for JSON queries. |
questdb_json_queries_cache_misses_total | counter | Total cache misses for JSON queries. |
questdb_pg_wire_queries_total | counter | Total PGWire queries. |
questdb_pg_wire_queries_completed_total | counter | Successfully executed PGWire queries. |
questdb_pg_wire_select_queries_cached | gauge | Current cached PGWire SELECT queries. |
questdb_pg_wire_update_queries_cached | gauge | Current cached PGWire UPDATE queries. |
questdb_pg_wire_select_cache_hits_total | counter | Total cache hits for PGWire select queries. |
questdb_pg_wire_select_cache_misses_total | counter | Total cache misses for PGWire select queries. |
questdb_pg_wire_errors_total | counter | Total errors in PostgreSQL wire protocol. |
questdb_unhandled_errors_total | counter | Total unhandled errors. Usually indicates critical service degradation. |
Connection metrics
| Metric | Type | Description |
|---|---|---|
questdb_http_connections | gauge | Currently active HTTP connections. |
questdb_line_tcp_connections | gauge | Currently active ILP TCP connections. |
questdb_pg_wire_connections | gauge | Currently active PGWire connections. |
TLS certificate metrics (QuestDB Enterprise)
These gauges report the number of seconds until the active TLS certificate expires for each endpoint. Values update on certificate reload, making it straightforward to set up alerting for upcoming expirations.
| Metric | Type | Description |
|---|---|---|
questdb_tls_cert_ttl_seconds_http | gauge | Seconds until TLS certificate expires for the HTTP endpoint. |
questdb_tls_cert_ttl_seconds_http_min | gauge | Minimum TLS certificate TTL for the HTTP endpoint. |
questdb_tls_cert_ttl_seconds_line | gauge | Seconds until TLS certificate expires for the ILP endpoint. |
questdb_tls_cert_ttl_seconds_pg | gauge | Seconds until TLS certificate expires for the PGWire endpoint. |
WAL metrics
| Metric | Type | Description |
|---|---|---|
questdb_wal_written_rows_total | counter | Total rows written to WAL. |
questdb_wal_apply_written_rows_total | counter | Total rows written during WAL apply. |
questdb_wal_apply_physically_written_rows_total | counter | Total physically written rows during WAL apply. |
questdb_wal_apply_rows_per_second | gauge | Rate of rows applied per second during WAL apply. |
questdb_wal_seq_txn | gauge | Sum of all committed transaction sequence numbers. Used with questdb_wal_writer_txn. |
questdb_wal_writer_txn | gauge | Sum of all applied transaction sequence numbers. With no pending WAL transactions, equals questdb_wal_seq_txn. A steadily growing lag indicates QuestDB cannot keep up with writes. |
questdb_wal_seq_txn_total and questdb_wal_writer_txn_total have been renamed
to questdb_wal_seq_txn and questdb_wal_writer_txn respectively.
JVM garbage collection metrics
| Metric | Type | Description |
|---|---|---|
questdb_jvm_major_gc_count_total | counter | Times major GC was triggered. |
questdb_jvm_major_gc_time_total | counter | Total time on major GC (ms). |
questdb_jvm_minor_gc_count_total | counter | Times minor GC pause was triggered. |
questdb_jvm_minor_gc_time_total | counter | Total time on minor GC pauses (ms). |
questdb_jvm_unknown_gc_count_total | counter | Times GC of unknown type was triggered. Non-zero only on non-mainstream JVMs. |
questdb_jvm_unknown_gc_time_total | counter | Total time on unknown type GC (ms). Non-zero only on non-mainstream JVMs. |
JVM memory metrics
| Metric | Type | Description |
|---|---|---|
questdb_memory_jvm_free | gauge | Free Java heap memory (bytes). |
questdb_memory_jvm_total | gauge | Current Java heap size (bytes). |
questdb_memory_jvm_max | gauge | Maximum Java heap memory (bytes). |
Native memory metrics
| Metric | Type | Description |
|---|---|---|
questdb_memory_mem_used | gauge | Current allocated native memory. |
questdb_memory_rss | gauge | Resident Set Size (Linux/Unix) / Working Set Size (Windows). |
questdb_memory_malloc_count | gauge | Times native memory was allocated. |
questdb_memory_realloc_count | gauge | Times native memory was reallocated. |
questdb_memory_free_count | gauge | Times native memory was freed. |
Native memory tag metrics
These gauges track memory allocated by specific QuestDB subsystems.
| Metric | Description |
|---|---|
questdb_memory_tag_MMAP_DEFAULT | Mmapped files. |
questdb_memory_tag_MMAP_O3 | O3 mmapped files. |
questdb_memory_tag_MMAP_TABLE_WRITER | Table writer mmapped files. |
questdb_memory_tag_MMAP_TABLE_READER | Table reader mmapped files. |
questdb_memory_tag_MMAP_INDEX_READER | Index reader mmapped files. |
questdb_memory_tag_MMAP_INDEX_WRITER | Index writer mmapped files. |
questdb_memory_tag_MMAP_INDEX_SLIDER | Indexed column view mmapped files. |
questdb_memory_tag_MMAP_BLOCK_WRITER | Block writer mmapped files. |
questdb_memory_tag_MMAP_IMPORT | Import operations. |
questdb_memory_tag_MMAP_PARALLEL_IMPORT | Parallel import operations. |
questdb_memory_tag_MMAP_PARTITION_CONVERTER | Partition converter operations. |
questdb_memory_tag_MMAP_SEQUENCER_METADATA | Sequencer metadata. |
questdb_memory_tag_MMAP_TABLE_WAL_READER | Table WAL reader mmapped files. |
questdb_memory_tag_MMAP_TABLE_WAL_WRITER | Table WAL writer mmapped files. |
questdb_memory_tag_MMAP_TX_LOG | Transaction log mmapped files. |
questdb_memory_tag_MMAP_TX_LOG_CURSOR | Transaction log cursor mmapped files. |
questdb_memory_tag_MMAP_UPDATE | Update operations. |
questdb_memory_tag_NATIVE_DEFAULT | Untagged native memory. |
questdb_memory_tag_NATIVE_O3 | O3 operations. |
questdb_memory_tag_NATIVE_RECORD_CHAIN | SQL record chains. |
questdb_memory_tag_NATIVE_TREE_CHAIN | SQL tree chains. |
questdb_memory_tag_NATIVE_COMPACT_MAP | SQL compact maps. |
questdb_memory_tag_NATIVE_FAST_MAP | SQL fast maps. |
questdb_memory_tag_NATIVE_FAST_MAP_INT_LIST | Fast map integer list. |
questdb_memory_tag_NATIVE_LONG_LIST | Long lists. |
questdb_memory_tag_NATIVE_HTTP_CONN | HTTP connections. |
questdb_memory_tag_NATIVE_PGW_CONN | PGWire connections. |
questdb_memory_tag_NATIVE_REPL | Replication tasks. |
questdb_memory_tag_NATIVE_CB1 | Circular buffer 1. |
questdb_memory_tag_NATIVE_CB2 | Circular buffer 2. |
questdb_memory_tag_NATIVE_CB3 | Circular buffer 3. |
questdb_memory_tag_NATIVE_CB4 | Circular buffer 4. |
questdb_memory_tag_NATIVE_CB5 | Circular buffer 5. |
questdb_memory_tag_NATIVE_CIRCULAR_BUFFER | Circular buffers. |
questdb_memory_tag_NATIVE_DIRECT_BYTE_SINK | Direct byte sink. |
questdb_memory_tag_NATIVE_DIRECT_CHAR_SINK | Direct char sink. |
questdb_memory_tag_NATIVE_DIRECT_UTF8_SINK | Direct UTF-8 sink. |
questdb_memory_tag_NATIVE_FUNC_RSS | Function RSS. |
questdb_memory_tag_NATIVE_GROUP_BY_FUNCTION | Group by function. |
questdb_memory_tag_NATIVE_ILP_RSS | ILP RSS. |
questdb_memory_tag_NATIVE_IMPORT | Native import operations. |
questdb_memory_tag_NATIVE_INDEX_READER | Native index reader. |
questdb_memory_tag_NATIVE_IO_DISPATCHER_RSS | IO dispatcher RSS. |
questdb_memory_tag_NATIVE_JIT | JIT compilation. |
questdb_memory_tag_NATIVE_JIT_LONG_LIST | JIT long list. |
questdb_memory_tag_NATIVE_JOIN_MAP | Join map. |
questdb_memory_tag_NATIVE_LATEST_BY_LONG_LIST | Latest by long list. |
questdb_memory_tag_NATIVE_LOGGER | Logger. |
questdb_memory_tag_NATIVE_MIG | MIG operations. |
questdb_memory_tag_NATIVE_MIG_MMAP | MIG mmapped files. |
questdb_memory_tag_NATIVE_OFFLOAD | Offload operations. |
questdb_memory_tag_NATIVE_PARALLEL_IMPORT | Native parallel import. |
questdb_memory_tag_NATIVE_PATH | Path operations. |
questdb_memory_tag_NATIVE_ROSTI | Rosti operations. |
questdb_memory_tag_NATIVE_SAMPLE_BY_LONG_LIST | Sample by long list. |
questdb_memory_tag_NATIVE_SQL_COMPILER | SQL compiler. |
questdb_memory_tag_NATIVE_TABLE_READER | Native table reader. |
questdb_memory_tag_NATIVE_TABLE_WAL_WRITER | Native table WAL writer. |
questdb_memory_tag_NATIVE_TABLE_WRITER | Native table writer. |
questdb_memory_tag_NATIVE_TEXT_PARSER_RSS | Text parser RSS. |
questdb_memory_tag_NATIVE_TLS_RSS | TLS RSS. |
questdb_memory_tag_NATIVE_UNORDERED_MAP | Unordered map. |
Worker metrics
| Metric | Type | Description |
|---|---|---|
questdb_workers_job_start_micros_max | gauge | Maximum time to start a worker job (microseconds). |
questdb_workers_job_start_micros_min | gauge | Minimum time to start a worker job (microseconds). |
Most of the above metrics are volatile, i.e. they're collected since the current
database start. The exceptions are questdb_wal_seq_txn and
questdb_wal_writer_txn, because transaction sequence numbers are persistent.
Configuring Prometheus Alertmanager
Full details on logging configurations can be found within the Logging & Metrics documentation.
QuestDB includes a log writer that sends any message logged at critical level
(by default) to Prometheus
Alertmanager over a
TCP/IP socket connection. To configure this writer, add it to the writers
config alongside other log writers.
Alertmanager may be started via Docker with the following command:
docker run -p 127.0.0.1:9093:9093 --name alertmanager quay.io/prometheus/alertmanager
To discover the IP address of this container, run the following command which
specifies alertmanager as the container name:
docker inspect -f '{{range.NetworkSettings.Networks}}{{.IPAddress}}{{end}}' alertmanager
To run QuestDB and point it towards Alertmanager for alerting, first create a
file ./conf/log.conf with the following contents. 172.17.0.2 in this case is
the IP address of the docker container for alertmanager that was discovered by
running the docker inspect command above.
# Which writers to enable
writers=stdout,alert

# stdout
w.stdout.class=io.questdb.log.LogConsoleWriter
w.stdout.level=INFO

# Prometheus Alerting
w.alert.class=io.questdb.log.LogAlertSocketWriter
w.alert.level=CRITICAL
w.alert.alertTargets=172.17.0.2:9093
Start up QuestDB in Docker using the following command:
docker run \
  -p 9000:9000 -p 8812:8812 -p 9009:9009 -p 9003:9003 \
  -v "$(pwd)::/var/lib/questdb" \
  questdb/questdb:6.1.3
When alerts are successfully triggered, QuestDB logs will indicate the sent and received status:
2021-12-14T18:42:54.222967Z I i.q.l.LogAlertSocketWriter Sending: 2021-12-14T18:42:54.122874Z I i.q.l.LogAlertSocketWriter Sending: 2021-12-14T18:42:54.073978Z I i.q.l.LogAlertSocketWriter Received [0] 172.17.0.2:9093: {"status":"success"}
2021-12-14T18:42:54.223377Z I i.q.l.LogAlertSocketWriter Received [0] 172.17.0.2:9093: {"status":"success"}